What Is Data Analytics, and How Does Data Analytics Work?
Learn data analytics helps businesses turn raw information into useful insights that support smarter planning, better customer experiences, and improved operations. In today’s digital world, understanding data analytics is becoming an important business and career skill.
What Is Data Analytics?
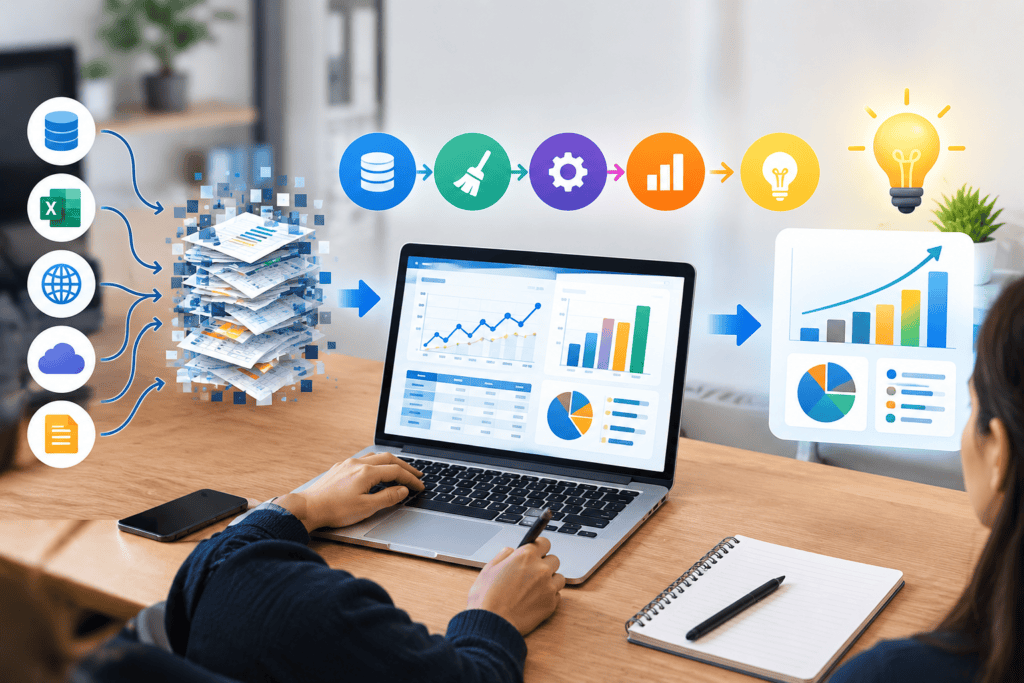
Data analytics is the process of collecting, cleaning, organising, examining, and interpreting data to discover useful patterns and insights. It combines statistical methods, technology, and business knowledge to answer questions and support practical decisions.
For example, a retail company can examine sales records to identify popular products, understand seasonal demand, and improve inventory planning. It turns numbers and records into information that people can use.
How Does It Work?
Learn Data Analytics generally begins with a business question or problem. Analysts gather relevant information from databases, spreadsheets, websites, applications, customer systems, and transaction records.
After collecting information, analysts clean and organise it before applying suitable analytical methods. The results are interpreted and communicated through reports, dashboards, charts, or recommendations.
What Are the Main Steps in IT?
The main steps include defining the problem, collecting data, cleaning the data, exploring it, analysing patterns, visualising results, and communicating findings. Each step helps ensure that the final insight is useful and relevant.

A typical project may start with a question such as why sales have declined. The analyst gathers sales and customer data, checks its quality, identifies important trends, and presents the findings clearly.
Why Is Data Analytics Important for Businesses?

Learn Data Analytics helps organisations understand what is happening across sales, marketing, finance, operations, and customer service. Instead of depending only on assumptions, businesses can use evidence to evaluate performance and identify opportunities.
It can also reveal trends that may not be obvious from individual records. When information is analysed consistently, organisations can respond to changing customer behaviour and improve their processes.
How Does Data Analytics Help in Decision-Making?
Learn Data Analytics supports decision-making by providing measurable evidence about performance, customers, costs, and market behaviour. Managers can compare results, identify trends, and evaluate options before making important decisions.
For instance, a company can examine conversion rates, customer acquisition costs, and revenue by marketing channel before deciding where to allocate its advertising budget.
What Are the Different Types of Data Analytics?
The four major types are descriptive, diagnostic, predictive, and prescriptive analytics. They answer different questions, ranging from what happened to what should potentially be done next.
Together, these approaches create a broader analytical process. Organisations can understand historical performance and then use forecasts and recommendations to support future planning.
What Is Descriptive?
Descriptive analytics focuses on understanding what has already happened. It summarises historical information using measures such as totals, averages, percentages, growth rates, and performance indicators.
Sales dashboards, monthly revenue reports, and website traffic summaries are common examples. This type helps organisations monitor performance and understand historical patterns.
What Is Diagnostic Data Analytics?
Diagnostic analytics investigates why something happened. Analysts compare variables, examine relationships, segment information, and investigate unusual changes to identify possible causes.
For example, if website sales suddenly decrease, an analyst may examine traffic sources, devices, product pages, pricing, and checkout behaviour to identify where the problem occurred.
What Is Predictive Data Analytics?
Predictive analytics uses historical data, statistical techniques, and machine learning models to estimate future outcomes. It is commonly used for demand forecasting, customer behaviour, risk assessment, and sales planning.
Predictions are not guarantees. Their quality depends on data quality, model design, assumptions, and whether future conditions resemble the information used to build the model.
What Are the Benefits of Data Analytics?

One major benefit of data analytics is better visibility into business performance. Organisations can identify trends, measure results, understand customer behaviour, and detect problems earlier.
Other benefits include improved forecasting, efficient resource allocation, stronger reporting, and better monitoring of key performance indicators.
How Does Data Analytics Improve Business Performance?
Learn Data Analytics can show which products, channels, processes, or customer segments are performing well and which require attention. Businesses can use these insights to improve strategies and allocate resources effectively.
For example, an online retailer can compare product conversion rates and repeat purchases to identify opportunities for merchandising and customer retention.
What Are the Common Data Analytics Techniques?

Common techniques include statistical analysis, trend analysis, segmentation, correlation analysis, forecasting, regression, clustering, and visualisation. The appropriate method depends on the question and the type of information available.
Analysts often combine several techniques rather than relying on one method. A project may use descriptive statistics to understand a dataset and predictive modelling to estimate future outcomes.
How Are Statistical Analysis and Data Analytics Used?
Statistical analysis provides methods for summarising data, measuring relationships, testing assumptions, and estimating uncertainty. It can include descriptive statistics, probability, hypothesis testing, correlation, and regression.
These methods help analysts distinguish meaningful patterns from random variation. Understanding statistics is therefore valuable when interpreting results and communicating findings accurately.
How Are Data Visualisation and Data Analytics Connected?
Data visualisation converts analytical results into charts, graphs, maps, and dashboards that make patterns easier to understand. Effective visuals can highlight trends, comparisons, outliers, and relationships quickly.
A well-designed dashboard should focus on the questions users need to answer. Clear labels and suitable chart types can make complex information easier to interpret.
How Does Predictive Modelling Work in Data Analytics?
Predictive modelling uses historical observations to build a mathematical or machine learning model that estimates future or unknown outcomes. Common approaches include linear regression, logistic regression, and decision trees.
Analysts can divide data into training and testing sets to evaluate model performance. They also examine metrics, assumptions, and potential sources of bias before using predictions.
What Tools Are Used for IT?

Different tools support different stages of analysis. Spreadsheets are useful for calculations and smaller datasets, SQL is important for databases, and business intelligence platforms help create interactive reports.
Programming languages such as Python and R are commonly used for advanced analysis, automation, statistics, and machine learning. Tool selection depends on project requirements and data complexity.
How Are Excel and SQL Used?
Excel is widely used for organising data, formulas, pivot tables, charts, filtering, and basic analysis. It is particularly useful for quick analysis, reporting, and structured datasets of manageable size.
SQL is used to retrieve, filter, join, aggregate, and transform information stored in relational databases. Learning SQL allows analysts to work directly with business databases.
How Are Power BI and Tableau Used for Data Analytics?
Power BI and Tableau are business intelligence platforms used to connect data sources, build visualisations, and create interactive dashboards. They allow users to explore metrics and share reports with stakeholders.
These tools can turn complex datasets into accessible visual reports. However, analysts still need to understand the underlying information because an attractive dashboard does not automatically produce accurate insights.
How are Python and R used in IT?
Python supports data preparation, statistical analysis, visualisation, automation, and machine learning through various libraries. It is popular because analytical workflows can also be connected with broader software and automation tasks.
R is designed strongly around statistics, data analysis, and visualisation. Both languages can handle advanced analytical work, with the choice often depending on the project and preferred workflow.
What Skills Are Needed for a Career in Data Analytics?

A career in data analytics requires a combination of technical knowledge, analytical thinking, communication, and business understanding. Professionals need to work with information while also explaining what their findings mean.
Beginners can develop these abilities through practical projects. Building dashboards, analysing datasets, writing SQL queries, and presenting insights can help create a job-ready experience.
What Technical Skills Are Required for It
Important technical skills include Excel, SQL, data visualisation, statistics, database concepts, and data cleaning. Python or R can provide additional capabilities for automation, advanced analysis, and machine learning.
Analysts should also understand data quality, basic data modelling, and common analytical metrics. Requirements vary depending on the role and industry.
What Soft Skills Are Important for Data Analytics?
Communication is essential because analysts must explain findings to people who may not have technical backgrounds. Critical thinking helps them question assumptions, investigate unusual results, and avoid unsupported conclusions.
Business understanding is equally important. An analyst who understands organisational goals can connect findings to practical questions and communicate insights more effectively.
What Are the Applications of Data Analytics?

Data analytics is used across industries because organisations in almost every sector generate information that can be measured and examined. Common applications include marketing, finance, healthcare, manufacturing, logistics, education, and e-commerce.
The specific use cases differ by industry, but the underlying process remains similar: collect relevant information, analyse it carefully, and use the resulting insights to support defined objectives.
How Is Data Analytics Used in Marketing?
Marketing teams analyse campaign performance, website behaviour, customer segments, conversion rates, and advertising costs. These insights can help marketers understand which channels and messages are generating useful results.
For example, a business can compare customer acquisition costs and conversion rates across campaigns to evaluate performance and plan future marketing activities.
How Is Data Analytics Used in Finance?
Financial teams use analytics for budgeting, forecasting, cash-flow analysis, fraud detection, risk assessment, and performance monitoring. Historical financial information can reveal trends that support planning and financial control.
Banks and financial organisations can also analyse transaction patterns to identify unusual activity. These systems may combine rules, statistical methods, and machine learning techniques.
How Is Data Analytics Used in Healthcare?
Healthcare organisations can analyse information related to patient care, hospital operations, resource utilisation, and outcomes. Analysis can support planning, quality improvement, and operational efficiency.
Because healthcare information can be sensitive, analytical work must also consider privacy, security, data governance, and applicable regulations.
How Is Data Analytics Used in E-Commerce?
E-commerce businesses analyse searches, product views, purchases, abandoned carts, customer segments, and repeat orders. These insights can support personalisation, inventory planning, pricing analysis, and customer retention.
For example, an online store can identify products frequently viewed together and use that information to improve product recommendations.
How Can Beginners Learn Data Analytics?
Beginners can start by learning the fundamentals of spreadsheets, data cleaning, basic statistics, SQL, and data visualisation. After learning the basics, they can practise with real or publicly available datasets.
Projects are especially useful for building confidence. A beginner might analyse sales data, create a dashboard, identify trends, and write a short explanation of the findings for a portfolio.
Start Your Data Analytics Journey with GICT
Want to build practical skills and prepare for career opportunities? GICT (Global Institute of Computer Technologies) helps learners develop industry-relevant computer and analytical skills through practical learning.
Take the next step toward building your professional skills. Contact GICT today to learn more and start your learning journey.
Conclusion
Data analytics provides a structured way to transform raw information into useful insights for business and organisational decisions. From descriptive reporting to predictive modelling, it can support better understanding, planning, and performance measurement.