Why Do Data Analysts Get Different Answers From the Same Dataset?
Consider a situation where two data analysts work on the same sales report. They examine the same spreadsheet, review the same transactions, and prepare their reports, yet the final figures differ. This may seem surprising, but it happens more often than you might think. Differences in calculations, data cleaning, and interpretation can cause data analysis errors.
Understanding why the same dataset produces different results helps analysts maintain accuracy and support reliable business decisions. This blog explores the common reasons behind these differences. It also explains how analysts can identify problems, improve consistency, and prepare accurate reports.
Understanding Why the Same Dataset Can Produce Different Results
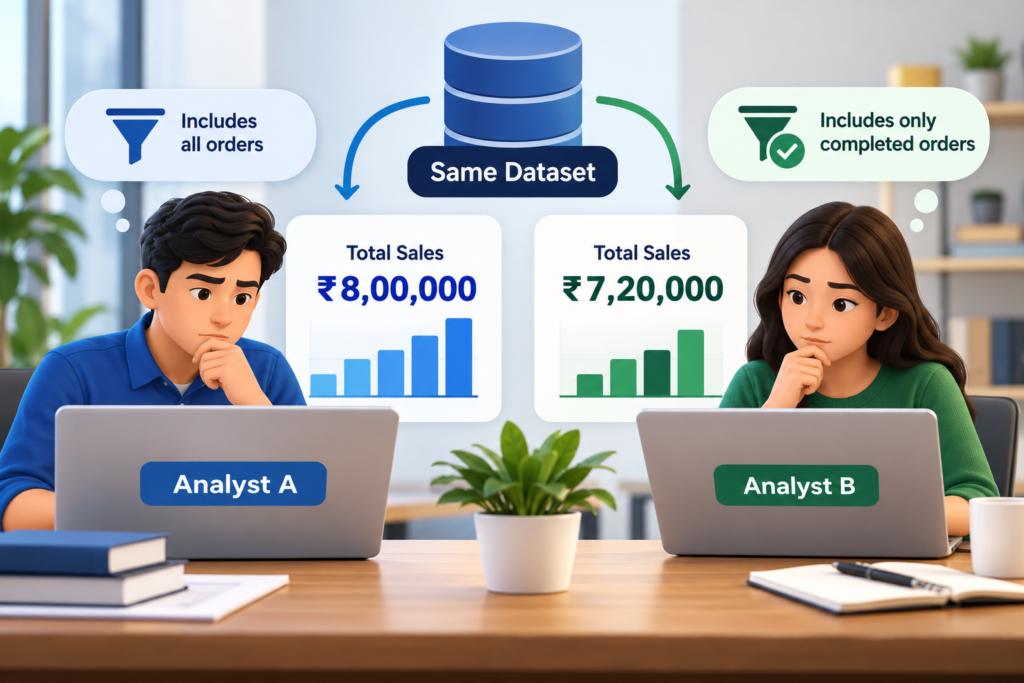
Having the same information does not guarantee the same results since there are several ways to interpret data. To illustrate, when a company wants to calculate its sales for a specific period, one analyst may include all the orders, whereas another person may only consider the completed ones.
Therefore, analysts must establish uniform criteria for analysing data sets. Once they define the conditions, differences in results become easier to explain.
How Data Interpretation Influences Analytical Results
Correct data interpretation is essential. Information alone cannot explain a result; analysts must understand the context before drawing conclusions. For instance, if a company tries to identify the reasons for its low sales, one analyst may look at the overall revenue, whereas another person may review the number of transactions.
While the first analyst tries to determine the average customer’s spending habits, the second person focuses on the number of customers. Each approach is applicable in a specific context.
The Role of Assumptions in Data Analysis
Analysts often begin with assumptions about a dataset. They should document each assumption and the evidence that supports it. For instance, one analyst may assume that a blank field means that the corresponding item is unavailable, whereas another person may believe that it is an indication of a missing value.
Naturally, such differences will lead to dissimilar results. This is why analysts should document their assumptions and supporting evidence.
Seven Common Reasons Data Analysts Get Different Answers

There are seven major reasons why two analysts may get different results when working with the same data set. Many problems start with data cleaning or calculations. Recognising these issues helps teams avoid them and improve accuracy and consistency.
Data Cleaning Errors and Preprocessing Approaches
Analysts usually preprocess a dataset before analysing it. This step removes irrelevant records and incorrect values. For example, an order with a NULL customer ID may need exclusion if the ID is required for the analysis. If analysts leave out unnecessary records inconsistently, they can produce inaccurate results.
For instance, if a spreadsheet has typos, such as “Delhi”, “delhi”, “DELHI”, a human reviewer would understand that they refer to the same city. In contrast, the programme would treat them as different values. As a result, the totals would be lower than expected. The same issue occurs when analysts work with duplicated records, which is why it is essential to ensure that the input data set does not have any duplicates.
Missing Values and Duplicated Records
Data analysts work with numerical information every day. They must still validate quantitative data carefully. For instance, if an analyst prepares a report on average order value, he or she should pay special attention to missing values, since they can greatly impact the result.
Similarly, duplicated records should be reviewed since they can also affect results, especially if the analyst works with summary information. If an analyst erroneously includes a ₹ 5,000 order twice in the report, the final figure will be ₹ 10,000.
Calculation Errors From Incorrect Formulas and Methods
An incorrect calculation method can cause data analysis errors in Excel, Python, SQL, and other tools. In most cases, the error is apparent at first glance, although there are situations when the final figure may seem reasonable.
For instance, when an analyst calculates average order value, he or she should divide the revenue by the number of orders, not customers. Although the result will still be a number, it will be irrelevant to the initial question. Thus, it is essential to review calculations and make sure that they make sense.
Data Analysis Errors From Different Filters and Selection Criteria
Analysts use Excel filters to narrow a dataset according to specific criteria. These selections define the scope of the analysis. For instance, if one analyst prepares a report on sales in September and another person works with data as of September 25th, the results will be different, even though both analysts used the same spreadsheet.
The same outcome can be observed when one analyst excludes cancelled orders from his or her consideration, whereas another person reviews all the transactions. Thus, analysts should document all the selection criteria they applied to the data set, including dates, categories, and excluded records.
Confusing Correlation With Causation
Analysts sometimes confuse causal relationships with coincidences. For instance, an analyst may claim that the increase in the company’s ad spend has caused higher sales, which may be true, yet there are several other influencing factors to consider.
Seasonality, promotions, and new product launches can affect sales in a similar manner regardless of the company’s marketing activities. A competent analyst would attempt to identify the strongest link by reviewing the p-value, which indicates how strong the relationship between two variables is. This will allow him or her to provide more accurate results to the stakeholders.
Different Statistical Models and Methods
Statistical models help analysts identify patterns in datasets. They can use these patterns to forecast future trends. These patterns are vital for many areas of business, including marketing, operations, and sales. While most statistical patterns are apparent, different models may yield different results, which should be taken into consideration by the analysts.
For instance, if an analyst studies the salaries in a company, he or she may calculate the mean and median and mistakenly consider them equal. In reality, these values are different, and the discrepancy should be explained.
Data Source Inconsistencies and Analysis Errors
Many companies store and manage data across different sources.For instance, a company may use one application for tracking sales, another tool for storing customer data, and a third utility for analysing marketing performance.
This approach creates multiple opportunities for errors since one data set may use a different definition of a metric compared to another one. For instance, if one application calculates revenue after discounts, whereas another tool uses the gross price, the results will be different, which should be disclosed by the analysts.
How Data Analysis Errors Affect Business Decisions

Different analytical approaches can cause data analysis errors. These errors can affect accuracy and lead to poor business decisions.
Managers, executives, and stakeholders rely on reports to make decisions. Errors can therefore affect their final recommendations.
Misleading Reports and Incorrect Business Insights
Analysts should remember that their findings shape many business decisions. Thus, it is essential to ensure that the final figures are correct, which is why reports should be reviewed before they are shared with the stakeholders.
For instance, when a company reviews its sales performance, the management team may see a record-breaking month and decide to invest more resources in the corresponding segment. In reality, the figures may have been inflated due to errors in data analysis, which means that the final results will underperform greatly.
Poor Forecasting and Decision-Making
When it comes to forecasting, companies rely on historical trends, which are only as good as the accuracy of data analysis. Thus, if the analysts prepare reports with inflated or deflated figures, the final projections will be inaccurate as well.
For instance, the same company mentioned above may experience a significant decrease in sales after relying on misleading information.
The Importance of Consistency in Key Performance Indicators (KPI)
Key performance indicators are essential for measuring progress towards specific goals. However, companies can only benefit from the aforementioned metrics if they understand how these figures are calculated.
For instance, if different departments use varying metrics, the final results will be inconsistent, providing an inaccurate view of the company’s performance. Thus, it is essential to establish uniform definitions, which will allow companies to measure their progress accurately.
Real-World Example: Two Analysts, One Dataset, Different Conclusions

Below is an example of a disagreement between two analysts that occurred when they tried to calculate the same metric using the same dataset.
Case Scenario
Assume that a company receives two analytical reports on the same topic from different analysts. When the executives try to compare the results, they discover that the final figures differ significantly.
To be more precise, Analyst A reports that the company’s sales for the last month were ₹ 800,000, whereas Analyst B got the result of ₹ 720,000. Naturally, the management wants an explanation, and the analysts begin their investigation. They try to determine what caused such a significant disagreement in the results and eventually realise that the problem was in the differing selection criteria.
How Different Filters Affect Sales Reports
When Analyst A prepared his report, he included all the orders, including the cancelled ones. Analyst B followed the standard practice of only including the confirmed and completed orders. As a result, Analyst B’s figure was lower than Analyst A’s result.
Nevertheless, the management still wants to know which result is correct, which raises more questions than answers. Analysts realise that the problem was in the definition of sales since there are several ways to calculate the metric.
Why Both Analysts May Get Different Results
The analysts quickly realise that they both followed their instructions correctly but got different results because they worked with different definitions of sales. Analyst A used the gross order value, whereas Analyst B followed the standard practice of only including the confirmed and completed sales.
Therefore, their reports were different, yet correct. In truth, both results are correct, but they represent different metrics.The difference between the results is significant, which should be explained to the executives, who are the primary stakeholders of the reports.
Identifying the Actual Source of the Discrepancy
At this point, Analyst A and Analyst B should review their reports and try to identify the exact source of the disagreement. They should check the data set and determine the corresponding sales records to see if the difference is in the cancelled orders and refunds. After they identify the source of the error, they should establish uniform criteria for sales analysis.
After these criteria are defined, Analyst A and Analyst B should recalculate the results and prepare a revised version of the report. If they follow the same rules and use the same data set, their results should coincide.
How to Identify and Fix Data Analysis Errors

When different results stem from the same data set, it is essential to identify the source of the problem to resolve it and ensure that it does not occur again.
Checking Each Step to Find Data Analysis Errors
Analysts should review the entire process to find the step that caused the disagreement. This approach will allow them to resolve the issue with relative ease. For instance, if two analysts get different results because of an incorrect formula, the main issue can be resolved by changing it to the correct one.
When searching for errors in the data analysis process, it is better to look for them systematically instead of randomly changing the calculations. A systematic approach to error detection and resolution is always more efficient.
Validating Information Beforehand
Before analysing a dataset, analysts should check that the information is complete and accurate. Analysts should look for any possible issues, including incorrect record counts and invalid entries. It is always better to detect them in the data set than after working with the information.
Establishing Uniform Rules for Data Cleaning and Preprocessing
When working with the same data set, it is essential to follow the same rules for editing and cleaning. It is normal for analysts to make minor adjustments to the data set when removing typos, incorrect entries, and other issues. Still, they should always follow uniform rules for preprocessing and cleaning.
Cross-Checking Excel Formulas, SQL Queries, and Python Scripts
Analysts should review Excel formulas, SQL queries, and Python scripts before sharing reports. Analysts should always make sure that they work with actual records and that their calculations actually make sense. For instance, when working with average order value, analysts should review the calculations on the most frequent records to ensure that they have the same result.
Documenting Assumptions About the Data Set
When working with data sets, analysts should document all the assumptions and information relevant to the data. This step is especially important when the analysts work with the same information, including different segments.
It is a good idea to briefly describe the processes and decisions to make it easier for colleagues to understand what has been done. This step is particularly important when the analysts are working with similar reports or when one person reviews the work of another.
Verifying Results With Independent Sources or Calculations
When results seem suspicious, analysts should check them against independent sources or repeat the calculations. This step is essential, considering that most issues stem from incorrect calculations. Even a few additional steps can make a significant difference and help prevent simple errors, which can be especially important when working with large volumes of data.
Best Practices to Prevent Data Analysis Errors

Preventing errors in data analysis requires an understanding of what sources of inaccuracy to address. While some mistakes can only be resolved on a case-by-case basis, some systematic issues can be resolved by establishing global rules for analysts.
Establishing Standard Operating Procedures for Data Analysts
Every analyst should be aware of the basic rules that apply to almost every data set. These guidelines may include uniform calculation rules, instructions for working with specific data sets, and general rules for preparing reports. The more structure there is, the easier it will be to detect and resolve discrepancies.
Using SQL, Excel, Python, and Power BI Consistently
SQL, Excel, Python, and Power BI are only tools, and they cannot guarantee accuracy unless the users know what they are doing. These programs can make the process of data analysis easier and faster, yet analysts should always review their results to ensure that they are accurate. The same principles apply to all the other areas of data analysis. The tools only make the work easier, but they do not guarantee accuracy and should only be used as assistants rather than decision-makers.
Keeping Track of Data Documentation and Version Control
It is important to keep track of analysts’ changes to queries, spreadsheets, and dashboards. This way, it will be possible to identify the exact source of the error and resolve it. This step is especially important when analysts collaborate since they all work with the same information.
Encouraging Analyst Collaboration
When it comes to accuracy in data analysis, collaboration often plays a decisive role. Having another set of eyes on the reports and calculations can often help identify potential issues that may have gone unnoticed otherwise.
Collaboration allows analysts to share their knowledge and experiences, which can be invaluable for resolving complex issues and improving the final results.
Build Your Data Analysis Skills With Practical Training
Are you interested in understanding how data works in real life? Would you like to be able to extract valuable information from spreadsheets to support your business decisions? If so, GICT welcomes you to enhance your analytical skills with computer courses.
You will learn how to use Excel, SQL, Python, and Power BI to organise, analyse, and present data in meaningful ways. With practical training, you will gain the confidence you need to grow your expertise in computer technologies. Contact GICT to build your practical skills and strengthen your expertise in data analytics.
Conclusion: Preventing Data Analysis Errors and Getting Reliable Results
Two analysts can get different results from the same dataset because they use different filters, calculations, cleaning rules, or statistical models. These differences can create data analysis errors. These factors and different interpretations can produce different results, even when both analysts are correct. Analysts should consider these issues whenever they use the same dataset. Resolving them improves consistency and helps management receive accurate information. Businesses can apply these principles to reduce reporting errors and avoid poor decisions. Addressing these issues helps companies rely on information that reflects the actual situation.
FAQs
Analysts can get different results when they use different filters, calculations, cleaning rules, statistical models, or sources. These are common data analysis errors. Uniform criteria and shared data sources help make results consistent.
The most common data analysis errors include different filters, missing values, incorrect calculations, varied statistical models, differences in sources, and incorrect data interpretations.
They can improve data accuracy by validating information, standardising rules, cross-checking calculations, documenting assumptions, and verifying results.
Excel, SQL, Python, and Power BI can help analysts reduce data analysis errors when used correctly. These programmes only assist analysts, which means that errors can occur if they are used incorrectly or without additional verification.
No, since AI tools are only assisting analysts. Thus, they can introduce more errors into the process by providing incorrect results or ignoring important information.